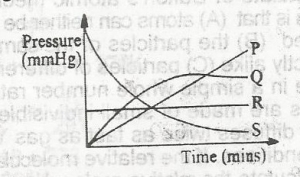
In the diagram above, the curve that represents the production of oxgyen gas from the decomposition of KCIO3 in the presence of MnO2 catalyst is
What is Exam without Practice? With our customizable CBT practice tests, you’ll be well-prepared and ready to excel in your examsStart Practicing Now