Jamb Economics Past Questions For Year 1993
Question 1

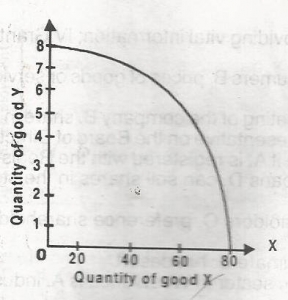
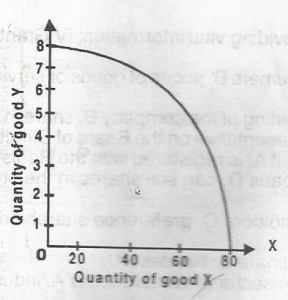
How many units of good X is produced for 8 units of commodity Y?
- A. 80
- B. 40
- C. 20
- D. O
Question 2

The above diagram showing the maximum possible combination of commodities X and Y produced in Nigeria is called the
- A. Production indicator
- B. Maximum production curve
- C. Production possibility curve
- D. Total output curve
Question 3

Given an output of 3 units, the average is
- A. N16.00
- B. N18.00
- C. 20.00
- D. 24.00
Question 4

Using the table calculate the net income
- A. N58m
- B. N54m
- C. N50m
- D. N46m
Question 5

From the diagram above, a shift in the demand curve from \(D_0 to D_1\) implies
- A. a rise in the demand for the commodity
- B. a fluctuation in the demand for the commodity
- C. a fall in the demand for the commodity
- D. an equilibrrium in the demand for the commodity