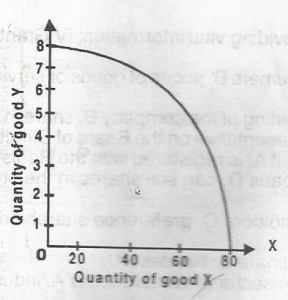
The above diagram showing the maximum possible combination of commodities X and Y produced in Nigeria is called the
The correct answer is C. Production possibility curve
No explanation given
Previous question
Next question
What is Exam without Practice? With our customizable CBT practice tests, you’ll be well-prepared and ready to excel in your examsStart Practicing Now